RF Circulator Isolation: How It Impacts Communication System Performance
Updated on:
Keywords: RF circulator, isolation, S31, insertion loss, VSWR, PA protection, receiver sensitivity, intermodulation, stability, VNA measurement, microwave, 5G.
Isolation (|S31|) in an RF circulator governs reflected-power containment, PA survivability, receiver sensitivity, spectral cleanliness, and stability margin. Here’s how to specify, measure, and sustain it across real-world conditions.
1.Introduction
In a three-port RF circulator, power ideally transfers from Port 1 → Port 2, Port 2 → Port 3, and Port 3 → Port 1. Isolation quantifies how much energy is prevented from leaking into the reverse path. Represented by |S31| (dB) for a 1→2→3 orientation, isolation protects the transmitter’s power amplifier (PA), preserves receiver sensitivity under imperfect antenna VSWR, and sustains overall linearity and stability.
Isolation: ≥18–23 dB narrowband; band-focused designs can exceed 25–30 dB.
Insertion Loss (|S21|): ≤0.3–0.6 dB; Return Loss (|S11|): ≥14–20 dB typical.
Improves PA survivability, reduces desense & IMD, and increases loop stability margin.
Engineering note. Isolation is frequency- and temperature-dependent. A single room-temperature number can be misleading for wideband radios or harsh environments.
2.Understanding Isolation in RF Circulators
2.1 Definition via S-Parameters
For a circulator oriented 1→2, 2→3, 3→1, the isolation from Port 1 to Port 3 is |S31| (dB). Peak isolation is usually specified near the center frequency and degrades toward band edges; the trade-off couples to |S21| and |S11| via ferrite bias, junction geometry, and matching networks.
2.2 Practical Ranges
Commercial and defense-grade circulators often specify isolation from ≥18 dB to ≥25–30 dB in a defined band. Achieving very high isolation across ultra-wide bandwidth is challenging, especially in compact microstrip/SMT constructions where the matching networks must remain low-loss and stable with temperature.
2.3 Interplay with VSWR and Linearity
Isolation acts with load match to constrain standing waves. Better isolation reduces back-flow into the PA and receiver front end, mitigating gain compression, AM/PM conversion, and intermodulation (IMD). Poor isolation plus poor VSWR can even set up oscillation-prone feedback loops in high-gain chains.
3.How Isolation Affects Communication System Performance
3.1 PA Protection & Efficiency
PA devices (LDMOS, GaN HEMT) are vulnerable to high reflected power. Adequate isolation steers energy reflected by antenna mismatch away from the PA output, reducing junction temperature spikes, preventing foldback, and improving mean-time-to-failure. In pulsed radar, isolation clamps transients that would otherwise drive compression.
3.2 Receiver Sensitivity and Desense
Isolation reduces leakage of Tx energy into the receiver chain, lowering desense and preserving noise figure (NF) & sensitivity. In TDD systems, residual Tx leakage during Rx windows elevates the noise floor; additional dB of isolation improves minimum discernible signal and dynamic range.
3.3 Spectral Purity & Intermodulation
Back-propagating energy in nonlinear elements generates spurs and IM products. Higher isolation reduces drive for these interactions, improving ACLR/ACPR and EVM—especially for wideband OFDM and multi-carrier SatCom.
3.4 Loop Stability
Reflections circulating around high-gain sections can create loop conditions. Isolation provides attenuation in potential feedback paths, expanding phase/gain margin and hardening borderline-stable designs.
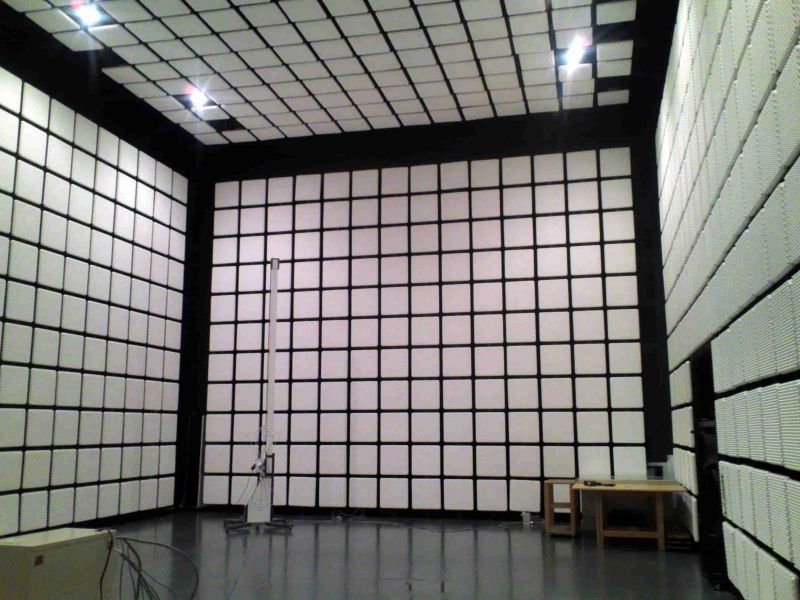
3.5 Environmental Robustness
Bias and matching drift with temperature and power. Radios that face qualification (aerospace, defense, outdoor basestations) should verify worst-case isolation across frequency and temperature, not just peak numbers.
4.Key Factors Influencing Isolation
4.1 Ferrite Material & Bias
Isolation depends on saturation magnetization, linewidth, Curie temperature, and magnet uniformity. Drifting bias fields reduce non-reciprocity and isolation; appropriate shielding and thermal design help.
4.2 Geometry & Matching
Y-junction topology, stripline/microstrip transitions, and multi-section matching are central. Wider bandwidth often needs more complex matching while holding loss and tolerance stack-up in check.
4.3 Construction Types
- Microstrip/SMT: Very compact; isolation limited by dielectric loss tangent, copper thickness, temperature coefficients.
- Drop-in: Solid thermal path and robust alignment; cavity tuning enables high isolation for radar front-ends.
- Coaxial: Strong shielding & power handling; competitive isolation over moderate bandwidths.
- Waveguide: Low loss and very high power; isolation can be exceptional in narrower bands.
4.4 Temperature, Power & Tolerances
Thermal expansion and magnet heating shift resonance and bias; machining/assembly tolerance impacts repeatability. Design for lifecycle drift and unit-to-unit variation.
5.Testing & Measurement
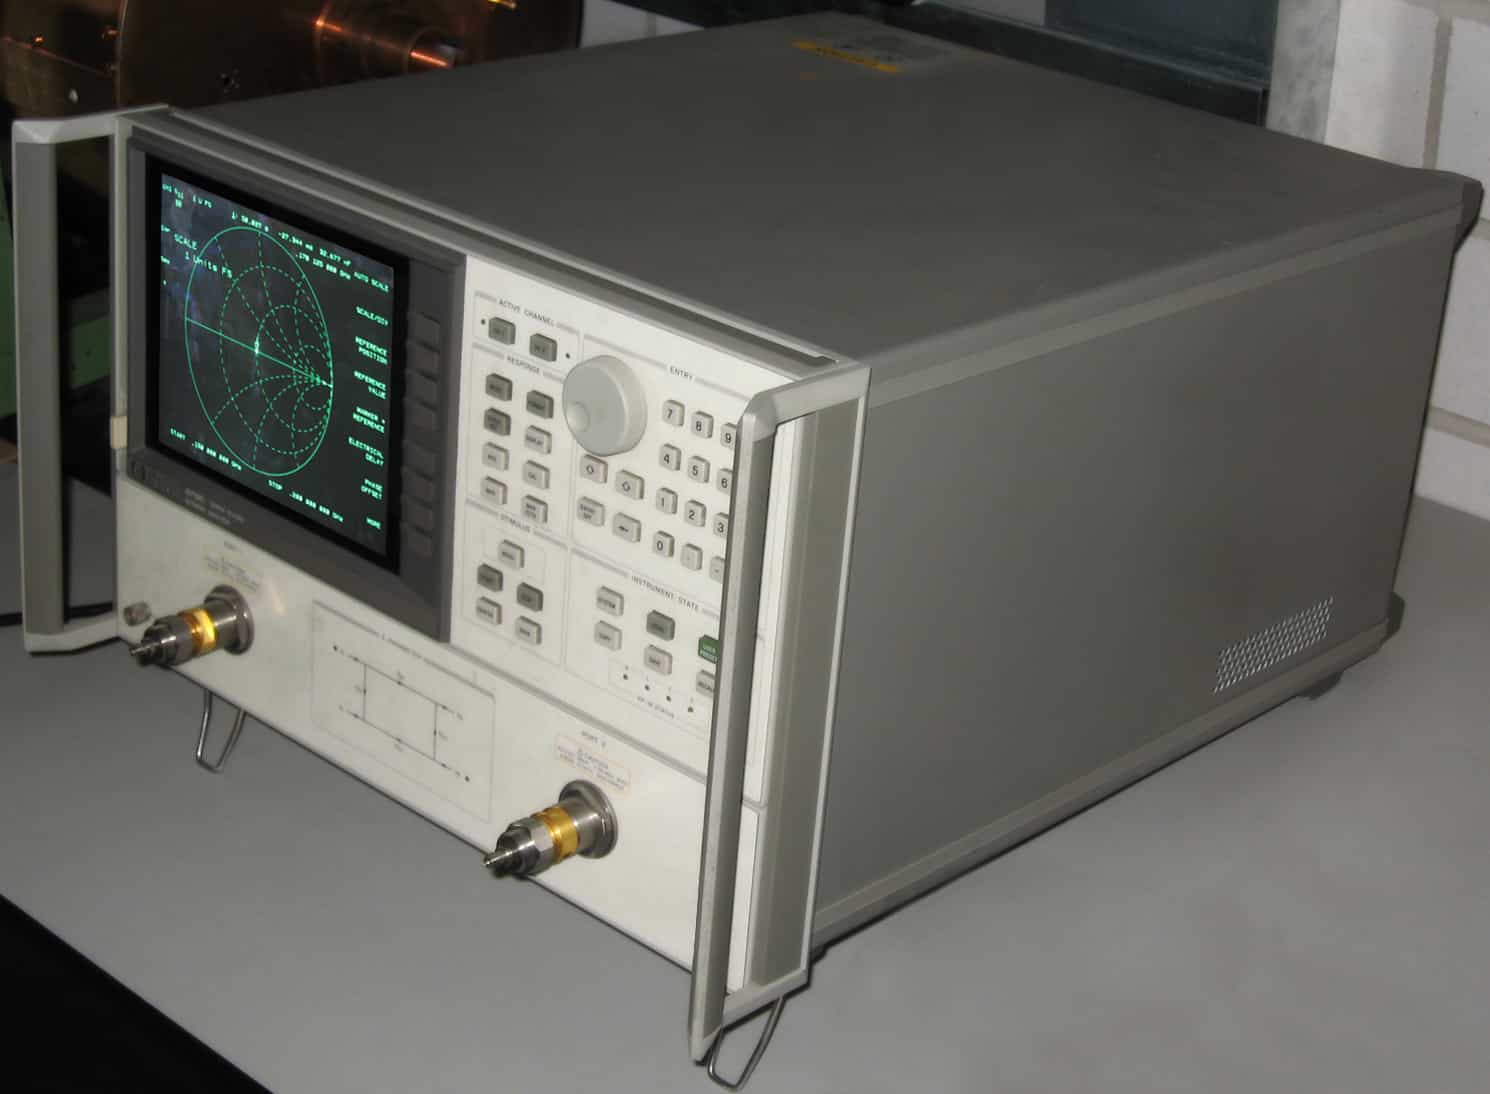
5.1 VNA Setup
Measure |S31| using calibrated 2- or 3-port VNA setups. Terminate unused ports with quality 50 Ω loads; avoid receiver saturation (add external attenuation if needed).
5.2 Calibration & Fixtures
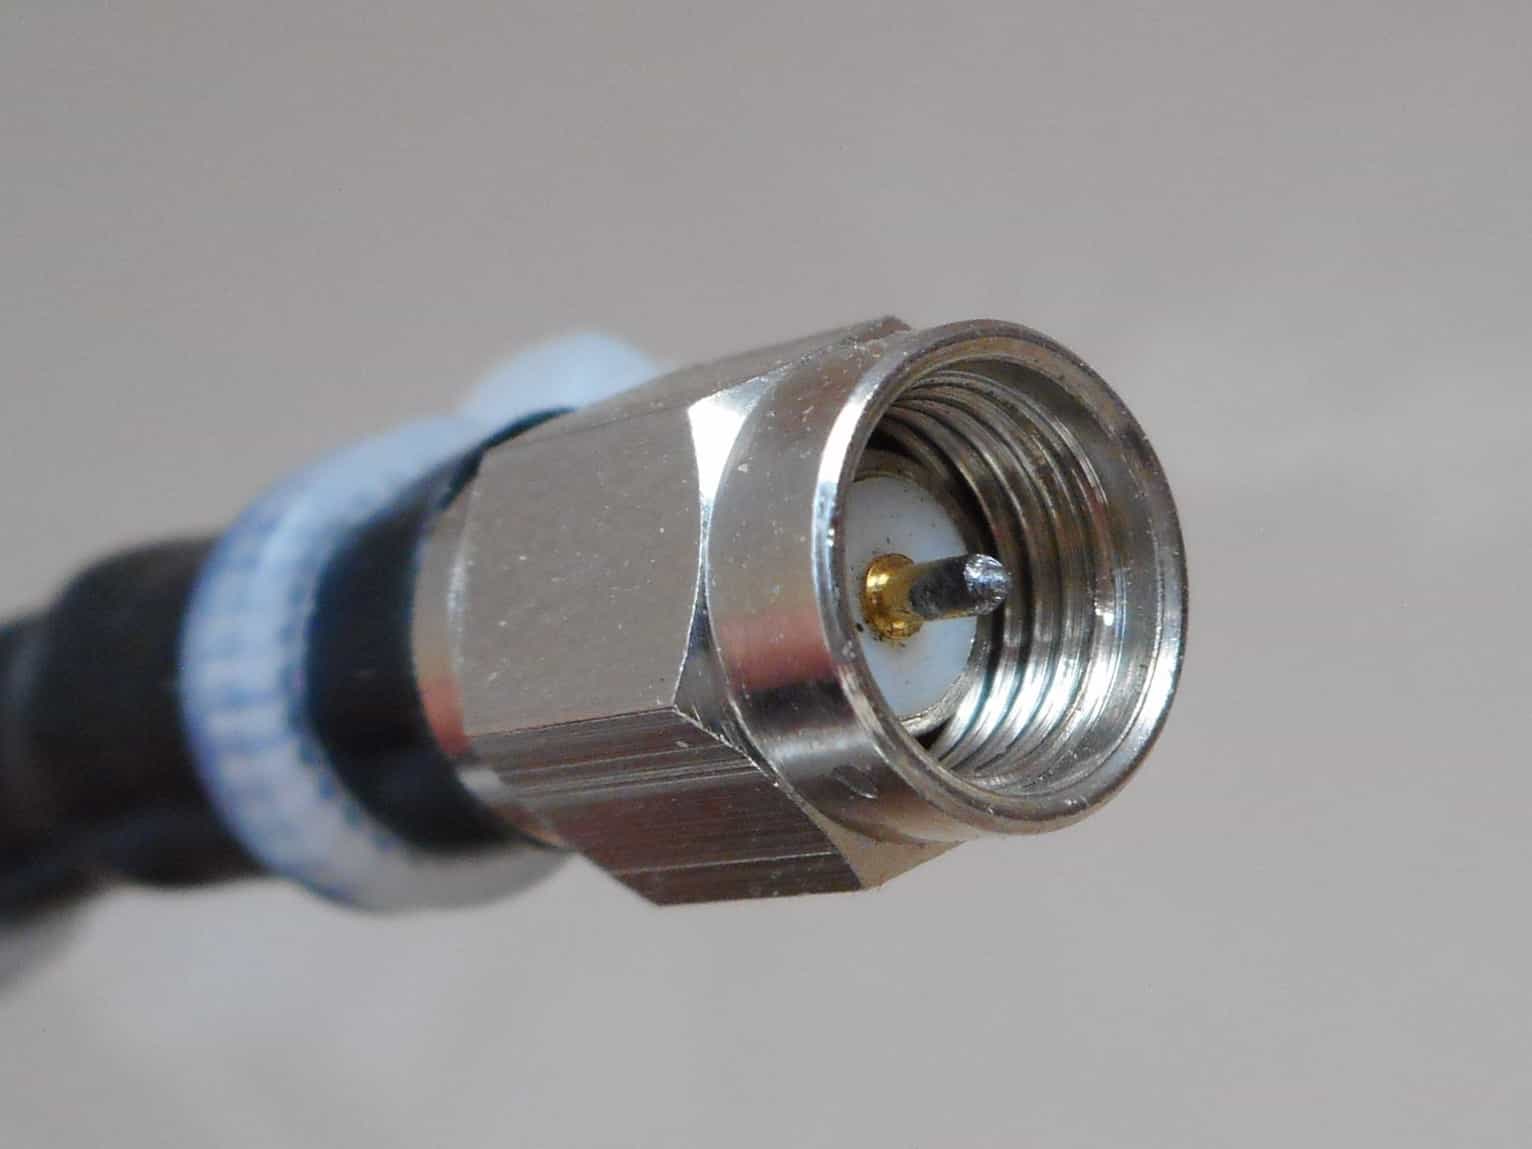
De-embed to the device reference plane. Use substrate-appropriate standards for microstrip/SMT; correct connector class & torque for coaxial. Poor fixtures can fake isolation notches.
5.3 Sweeps, Dwell & Temperature
Account for dwell-time/self-heating; sweep with sufficient resolution; characterize from −40 °C to +85 C (or mission range). Log worst-case isolation, not just peak.
5.4 Interpreting Plots
Watch for ripples/notches indicative of parasitic couplings. Use TDR/TDT to localize fixture issues. Track repeatability across samples for production control.
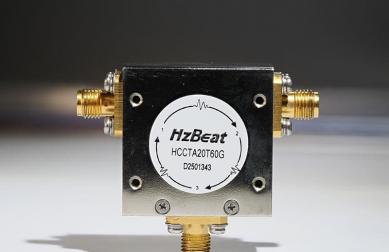
6.High-Isolation Solutions (HzBeat)
HzBeat optimizes isolation, insertion loss, and stability jointly across construction types. For high-power radios, coaxial circulators deliver strong shielding and power handling; for tightly integrated front-ends, drop-in circulators offer robust thermal paths and cavity-level tuning across UHF to Ka-band.
- Isolation: Band-optimized targets ≥20–25 dB typical.
- Insertion Loss: Low-loss matching preserves link budget/NF.
- Stability: Mechanical tolerance & magnet uniformity selected for lifecycle consistency.
Selection tip. Tie the isolation spec to antenna VSWR, PA ruggedness, and desense budget. For multi-carrier SDR links, aim for a guaranteed isolation floor across the operating band.
7.Conclusion
Isolation is the circulator metric that keeps your radio honest: it shields PAs, protects receivers, and buys stability margin against reflections and environmental drift. Specify it alongside |S21| and |S11|, verify with disciplined VNA practice, and design for worst-case, not just a room-temp peak. A few consistent dB often separates a temperamental demo from a field-proven system.
FAQ
Q1. How much isolation do I need?
For many links, ≥20 dB is a pragmatic baseline; radar or high-power PAs may require ≥25–30 dB in narrower bands. Relate the target to VSWR, PA ruggedness, and desense limits.
Q2. Isolation vs insertion loss?
Both matter: isolation protects and cleans spectra; insertion loss hits link budget and NF. Optimize the pair for your architecture.
Q3. Why does isolation drop at temperature extremes?
Ferrite bias and resonance shift with temperature & magnet characteristics; mechanical expansion perturbs matching, moving the isolation peak.
Q4. Can I improve isolation without changing the part?
Sometimes: adjust bias (if allowed), improve matching/terminations, shorten fixtures/grounds; else select a band-optimized variant.
Q5. How to verify on bench?
Calibrated VNA, proper terminations, avoid overload, and log worst-case vs frequency & temperature. De-embed for microstrip/SMT.
Relateds


About the Author

HzBeat Editorial Content Team
Marketing Director, Chengdu Hertz Electronic Technology Co., Ltd. (Hzbeat)
Keith has over 18 years in the RF components industry, focusing on the intersection of technology, healthcare applications, and global market trends.